ABX testing is a form of audio testing where two components (A and B) are carefully matched with respect to level, some means is included to at will switch between the two during the course of a musical passage, and the listener is completely unaware of which is which (X). This is the “de facto” standard for serious audio testing. It is an excellent approach in principle, however there is a serious flaw: it only allows for the detection of gross differences due to the relatively brief samples involved.
The Heisenberg Uncertainty Principle in its most common form states that:
$$\Delta x\Delta p\geq \frac{\hbar}{2}$$
Where $$\Delta x$$ is the uncertainty in position, $$\Delta p$$ is the uncertainty in momentum, and $$\hbar$$ is Plank’s constant divided by $$2\pi $$.
There is another form that gives the same relationship for energy and time:
$$\Delta E\Delta t\geq \frac{\hbar}{2}$$
Where $$\Delta E$$ is the uncertainty in energy and $$\Delta t$$ is the uncertainty in time.
What does this have to do with ABX testing you may ask? Well, nothing actually, as the principle does not apply to the macroscopic world due to the extremely small value of Plank’s constant. However, it provides insight to the issue of ABX testing. I propose that there is a similar relationship between the perceived difference and the listening interval. Let’s denote this as follows:
$$\Delta \varepsilon \Delta \tau \geq k$$
Where $$\Delta \varepsilon$$ is the uncertainty of the listener as to whether a difference exists or not, $$\Delta \tau$$ is the interval during which the listener compares the two components, and $$k$$ is is a listener-dependent constant (i.e. it is larger for “tin ears” and smaller for “golden ears”).
The bottom line is that a given listener will be able to detect finer and finer differences between two components over time. This means you really have to “live” with a component for some time to appreciate the subtle differences between it and another component. Unfortunately, it is very difficult to be objective with a long term test such as this, but I have no doubt that somebody will ultimately figure out a way of doing it.
Posted in Psychoacoustics | 2 Comments »

Hephaestus Audio continues to grow! I am very happy to share these press releases and web ads for the HMA-1000:
From Mr. Srajan Ebaen’s 6moons:
http://www.6moons.com/news/news.html
From Mr. Matej Isak’s Mono & Stereo:
http://www.monoandstereo.com/2009/03/hephaestus-audio-hma-1000-kilowatt.html
From Mr. Clement Perry’s Stereo Times:
http://www.stereotimes.com/speak031709.shtml
From Mr. Steven Rochlin’s Enjoy the Music:
http://www.enjoythemusic.com/news/0409/
Posted in Hephaestus Audio | 1 Comment »
Linearity is the exception rather than the norm. We live in a very nonlinear world – for example, it is now known that a sinusoidally driven resistor/diode/inductor combination can exhibit chaotic behavior! Please refer to this excellent SPS Report.
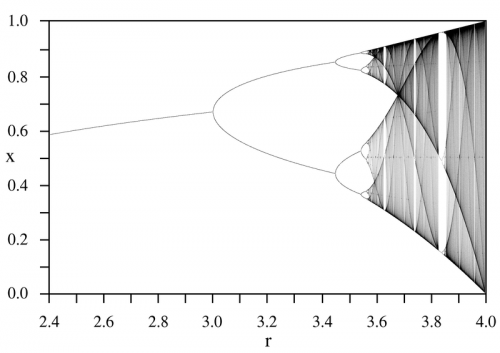
One of the simplest equations that demonstrates this nonlinear behavior – this chaos – is the “Discrete Logistic Equation” or the “Logistic Map“. Mathematically, it is given by:
$$x_{k+1}=rx_{k}\left(1-x_{k}\right)$$
This is typically used as a simple model of population growth with finite resources (i.e. food). $$x_{k+1}$$ represents the population at the next time step, based on that at the previous time step $$x_{k}$$ where $$0\leq x_{k}\leq 1$$ with “growth rate” $$r$$ where $$0\leq r\leq 4$$. A plot of the logistic map with respect to growth rate is given below for the interval $$2.4\leq r\leq 4.0$$:
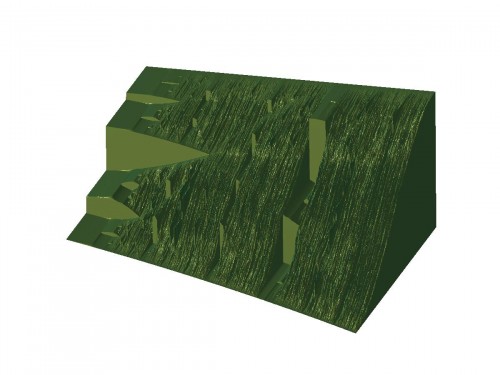
Using MATLAB, more sophisticated visualization is possible that may give greater insight into what is happening to the population dynamics as the growth parameter is varied. For example, how the periodic regions return to chaos via a period-doubling bifurcation. Shown below is the interval $$3.5\leq r\leq 4.0$$:
One lesson to take from all this with respect to audio electronics is that simplicity is best! If a resistor/diode/inductor can result in chaos, then what can the circuitry in an overly complicated amplifier do? Not only in electronics is simplicity the best, for example in Strunk and White’s The Elements of Style there is the simple mantra: “Omit needless words!” Vastly different disciplines – same guiding principle.
Posted in Physics | Comments Off on Chaos and the Logistic Map

There is much confusion over amplifier power ratings. There are two primary things to be aware of: what type of measurement a given rating represents and what this means as far as one’s listening experience. The former is fairly objective while the later is very subjective.
Continuous RMS
This is the most rigorous of the power measurements, although even in this category there are a few “flavors”. For example, what is “continuous”? Ten seconds or ten years? Also, is this at one frequency (e.g. 1kHz), the full audio bandwidth (e.g. 20Hz-20kHz), or the full bandwidth of the amplifier (e.g. 5Hz-100kHz)?
The next question is how appropriate this measurement is for an audio amplifier. It is probably very appropriate for a precision programmable ac power supply, but I’m not sure how many people listen to continuous full-amplitude sine waves. Some may feel better knowing their amplifier will be well within its limits with audio material, but as far as actual audio quality, there isn’t much benefit.
Burst Power
Like with continuous RMS there are a few ways of interpreting this measurement. Is this the peak power of a continuous sine wave, in which case it is double the continuous RMS value, or does this represent the maximum instantaneous power, in which case it is a function of the power supply rail voltage at idle and the lowest allowable load impedance?
There is some merit to this sort of measurement, but the burst interval should be of a reasonable length. A 20mS burst test is common with very high power amplifiers, such as those from Powersoft or Lab.Gruppen. Measurement of actual program material indicates that a 200mS interval may be more appropriate – please refer to this AES paper. Given a reasonable burst interval, this test is probably the most useful for amplifiers intended to reproduce audio material. Please note that this burst power measurement may be given as either “peak” or “RMS”, with the former having twice the value of the latter.
EIAJ
This is a measurement of the saturated square wave power of the amplifier and is common with consumer and car audio products. It tends to give an inflated power rating, which is no doubt why it is popular with low-quality audio products.
This test may be useful for giving a feel of what an amplifier is capable of when severely overdriven, but is not really appropriate for high-quality audio products.
Posted in General Audio | 1 Comment »
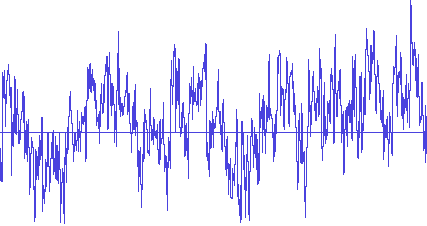
This article shows the measured crest factor of some representative pieces of music. The conclusion is that, for a “typical” home audio setup, peak power in excess of 500 Watts may be required for an average power level of only a few Watts, if the goal is clean (i.e. unclipped) audio.
Note that heavily compressed audio has much lower crest factor (i.e. headroom) requirements. However, the average listening level is typically much higher, so the peak power requirements are still comparable.
Posted in General Audio | Comments Off on Crest Factor
There are some amazing parallels between color theory and music. The color wheel is a basic tool from color theory that shows the relationship between the colors of the rainbow. Colors directly across from each other are called complementary colors and tend to give the most striking contrast.
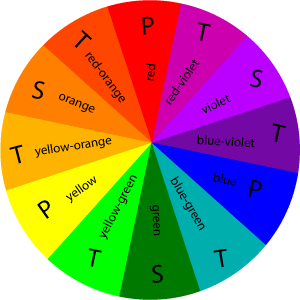
These colors may be combined using various color schemes – each giving its own sort of “feel”. If each of these colors is now associated with a note from the chromatic scale, then it turns out that the way a color scheme is perceived is very similar to the way the associated note combination is perceived.
Yellow → C
Yellow-orange → C#/Db
Orange → D
Red-orange → D#/Eb
Red → E
Red-violet → F
Violet → F#/Gb
Blue-violet → G
Blue → G#/Ab
Blue-green → A
Green → A#/Bb
Yellow-green → B
This “mapping” is somewhat arbitrary and could be shifted, provided the order is maintained. Is C a “yellow” note? I don’t know, but perhaps somebody who experiences synesthesia would have a preference. Here are some examples of color combinations and the associated note combinations:
Monochromatic / single note
A single color or a single note is generally uninteresting (unless you really just love that color/note).
Analagous / dyad
An analagous color scheme uses two nearby colors on the color wheel. It is much more interesting that a monochromatic color sheme. A dyad consists of two notes, again this gives much more interest than a single note.
Complementary / tritone
A complementary color scheme is very striking and gets your attention. It is good for adding interest, but a little goes a long way. In music, the tritone is the most dissonant of intervals and is used sparingly to create tension.
Split complementary / chord
Rather than using the color directly across on the color wheel, a color on either side is used. This creates a pleasing combination without the stark contrast of the complementary color scheme. Similarly, a musical chord creates interest, potentially even more than a dyad, while not being as dissonant as the tritone.
Posted in Music | 3 Comments »

“Beauty is truth, truth beauty, – that is all ye know on earth, and all ye need to know.” – John Keats
A former co-worker of mine, Alexey Astanovitskiy, told me what his father had told him with regard to electronics design: “If it looks beautiful, then it will work beautiful.” He was a very gifted designer and I have sought to emulate his example ever since.
This beauty in design goes beyond that which the customer is intended to see (i.e. the outside of the product) – it is in every aspect of the design, right down to the layout of the PCB. Take off the cover and look inside (please unplug the unit, allow some time for the capacitors to discharge and don’t touch anything). Was the layout put together last minute with little attention paid to aesthetics and the difficulties of switching design? Was the designer involved with this critical part of the design, or was it simply handed off to a layout person to “finish it up”? Gaps like this in execution can turn an excellent design into a marginal product.
It is the little details that make a big difference. The ones that nobody may ever be consciously aware of. However, audiophiles do have an interesting habit of noticing these “little details”.
Posted in General Audio | Comments Off on Beauty is Truth
The precedence effect is a particularly important psychoacoustic effect for audio systems. Based on arrival time, a given sound is broken up into three distinct bands:
t < 5mS
This is the first arrival interval. It is essential for localization.
5 mS < t < 30mS
This is the integration interval. Any additional sound that has the same “nature” as the original will be integrated and will not affect localization information.
30mS < t
This is the interval beyond the domain of the precedence effect. Any additional sound that has the same “nature” as the original will be perceived as a quick echo.
What does this mean for audio system design? For pro audio applications, it allows for sound reinforcement – for example public address. The source itself may be much lower level than the reinforcement, but as long as the source precedes the reinforcement by about 5mS to 30mS, the source will still be perceived as the origination of the sound. For audiophile applications, it means that a loudspeaker should have minimal stored energy if there is to be any hope of presenting a stereo image. Also, diffraction should be minimized, as this produces multiples sources with an arrival time that falls within the 5mS window – thereby confusing localization.
Posted in Psychoacoustics | Comments Off on Precedence Effect
Hamiltonian mechanics is an elegant way of formulating problems is classical mechanics. Also, it provides insight into the world of quantum mechanics, as is evident with the Schrodinger equation.
The basic equations:
$$\dot{q}=\frac{\partial }{\partial p}H$$
$$\dot{p}=-\frac{\partial }{\partial q}H$$
Where $$q=q(t)$$ are the generalized coordinates and $$p=p(t)$$ are the generalized momenta. H is the Hamiltonian and represents the total energy of the closed system (i.e. conservative) under consideration. $$H=T+V$$ where T is the kinetic energy and V is the potential energy. Also note that $$\dot{q}$$ represents the time derivative of the position, or the velocity, and that $$\dot{p}$$ represents the time derivative of the momentum, or the force.
These two equations yield the evolution of the mechanical system. Aesthetically they are quite pleasing, owing to their nearly perfect symmetry.
Posted in Physics | Comments Off on Physics Friday – Hamiltonian Mechanics

The design of the magnetics for switching supplies and switching amplifiers can be very challenging. There tends to be an aura of mystery surrounding it, thus making things even worse, but with a few good guidelines and some carefully selected resources it can be reduced to as near a science as engineering ever is…
Guidelines:
• The primary and secondary windings should be as close to each other as possible over their entire extent. Unfortunately isolation requirements do not usually allow for this.
• If a winding is inserted between a primary and a secondary, then a current will flow in this winding – this can result in significant extra losses. If it is necessary to do this (e.g. multiple windings in a flyback), then the highest power secondary windings should be placed closest to the primary.
• Making a single winding with multiple layers can result in very high losses. Refer to “Dowell’s Curves” to see how the number of layers affects the ratio of ac to dc resistance.
• With two adjacent windings, the current will tend to flow on the inside surface of each winding – this is the proximity effect. This results in even less effective conductor area than would be estimated given the skin effect alone.
• As a general guideline, make core losses as high as practical, relative to copper losses. This helps to decrease leakage inductance, copper losses, etc.
• Gapped ferrite cores often yield lower core losses than powdered iron cores, however the fringing field due to the discrete gap can result in significantly higher copper losses.
Resources:
• An estimate of the magnetic losses in a design
• A list of magnetics design “myths” from Ridley Engineering
• Eddy Current Losses in Transformer Windings by Lloyd Dixon
• Magnetics Design for Switching Power Supplies – Section 3 by Lloyd Dixon
• Switching Power Supply Design by Abraham Pressman
• Fundamentals of Power Electronics by Robert Erickson
Posted in Switching Amplifiers | Comments Off on Magnetics Design


