Linearity is the exception rather than the norm. We live in a very nonlinear world – for example, it is now known that a sinusoidally driven resistor/diode/inductor combination can exhibit chaotic behavior! Please refer to this excellent SPS Report.
One of the simplest equations that demonstrates this nonlinear behavior – this chaos – is the “Discrete Logistic Equation” or the “Logistic Map“. Mathematically, it is given by:
$$x_{k+1}=rx_{k}\left(1-x_{k}\right)$$
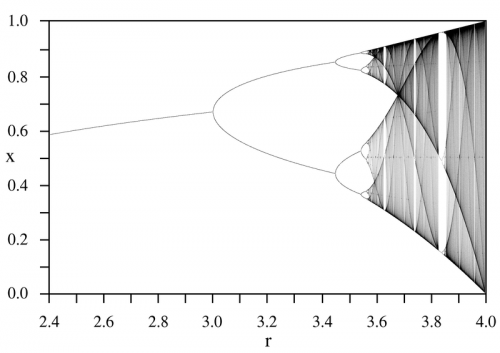
This is typically used as a simple model of population growth with finite resources (i.e. food). $$x_{k+1}$$ represents the population at the next time step, based on that at the previous time step $$x_{k}$$ where $$0\leq x_{k}\leq 1$$ with “growth rate” $$r$$ where $$0\leq r\leq 4$$. A plot of the logistic map with respect to growth rate is given below for the interval $$2.4\leq r\leq 4.0$$:

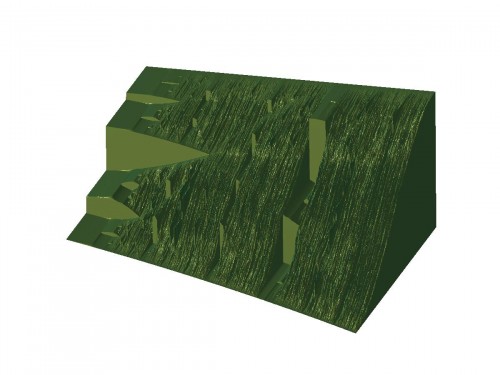
Using MATLAB, more sophisticated visualization is possible that may give greater insight into what is happening to the population dynamics as the growth parameter is varied. For example, how the periodic regions return to chaos via a period-doubling bifurcation. Shown below is the interval $$3.5\leq r\leq 4.0$$:
One lesson to take from all this with respect to audio electronics is that simplicity is best! If a resistor/diode/inductor can result in chaos, then what can the circuitry in an overly complicated amplifier do? Not only in electronics is simplicity the best, for example in Strunk and White’s The Elements of Style there is the simple mantra: “Omit needless words!” Vastly different disciplines – same guiding principle.
